Queue Analytics for Retail and Service Operations: From Camera Feeds to Faster Customer Service
Long queues are visible long before they appear in customer complaints or monthly reports. Queue analytics can turn suitable camera feeds into real-time operational signals that help teams respond sooner, deploy staff more effectively and measure recurring service bottlenecks.
Customers rarely complain the moment a queue begins to form.
They wait. They look around. They reconsider the purchase. They leave quietly. Or they complete the transaction but remember the delay.
By the time queue problems appear in customer feedback, abandoned baskets, missed appointments or monthly performance reports, the operational moment has already passed.
Queue analytics is useful because it makes waiting conditions visible while teams can still respond.
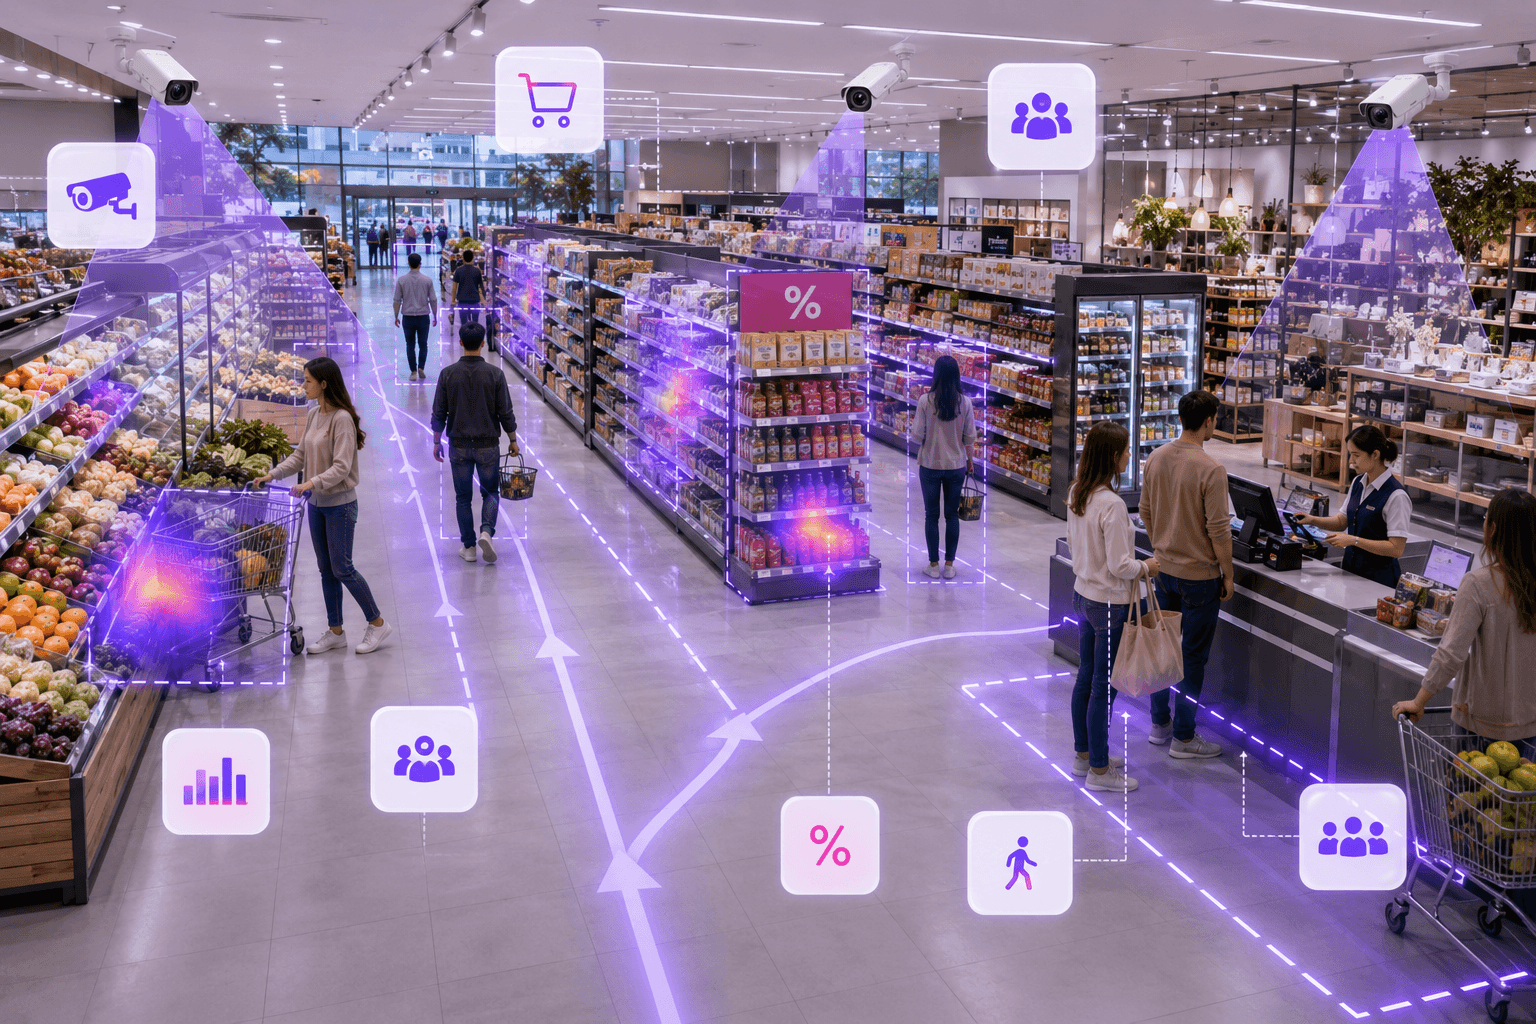
Using suitable existing camera feeds, an AI video intelligence system can estimate queue length, observe how long a service threshold remains exceeded, create an operational event and notify the people responsible for opening another counter, reallocating staff or investigating a recurring bottleneck.
The value is not simply that the system can count people. The value is that it can connect a visual condition to a service rule and a practical response.
What Queue Analytics Actually Measures
The phrase “queue analytics” is often used loosely. A useful enterprise deployment should define exactly what is being measured and why it matters.
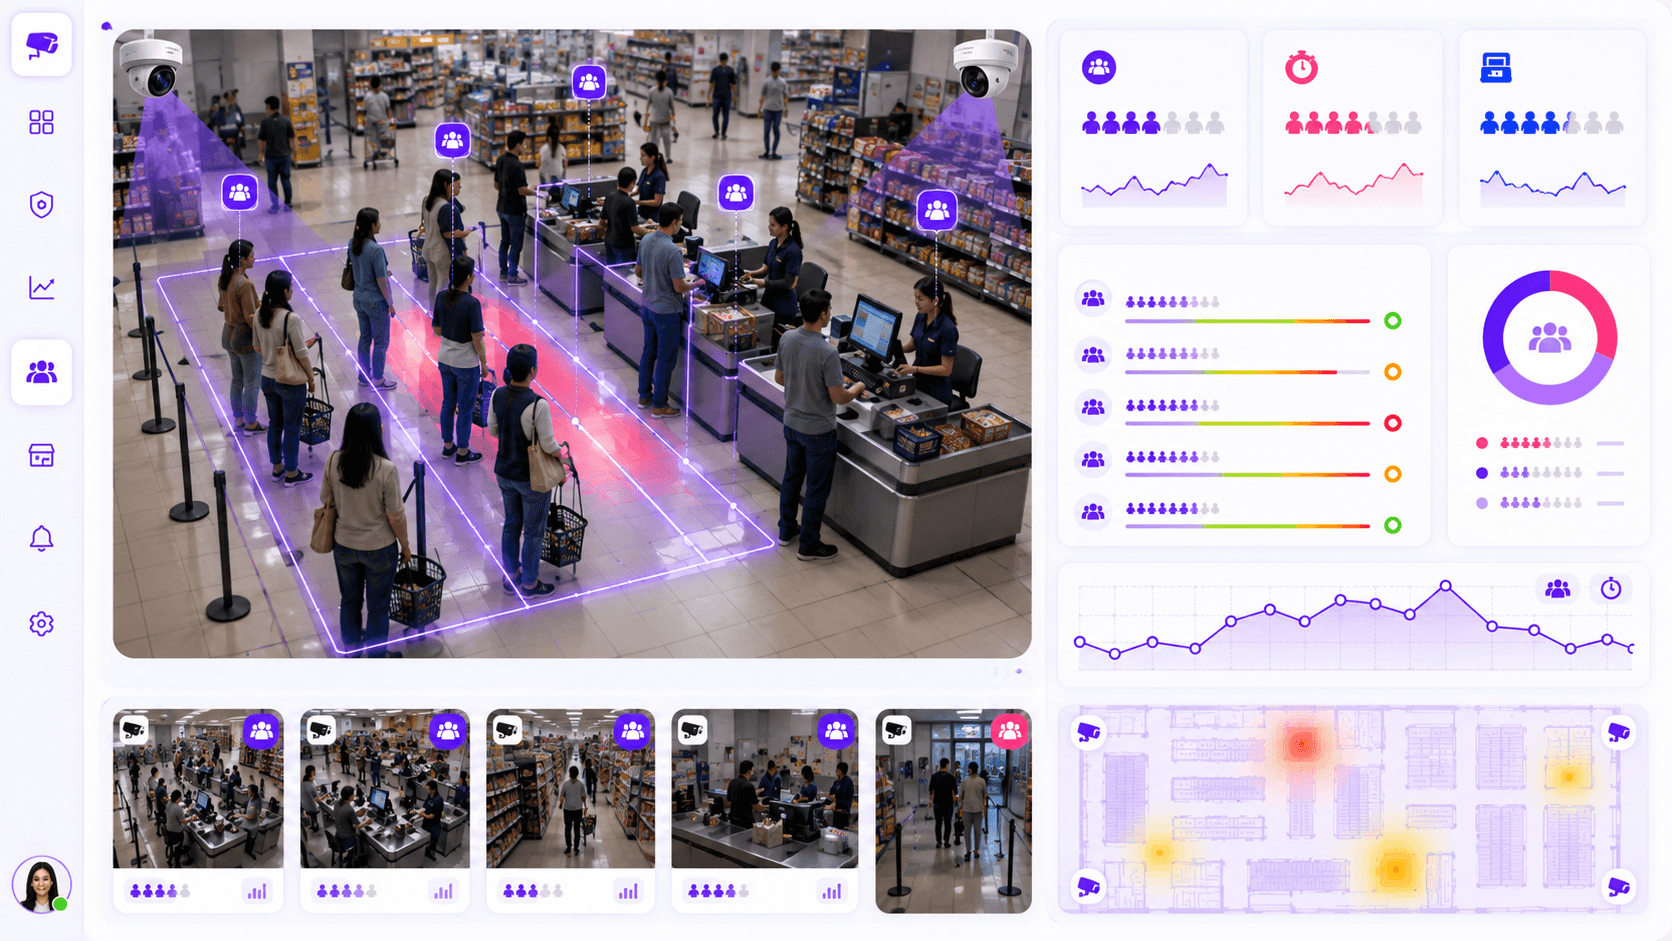
Depending on the environment, the system may evaluate:
- Number of people waiting in a defined queue zone
- Time that queue length remains above an agreed threshold
- Approximate customer wait duration where the scene supports it
- Number of active versus inactive service points
- Queue growth during peak periods
- Recurring congestion by time, location or day
- Operational response after a threshold breach
These measurements should be linked to a clear business question.
For example, a supermarket may want to know when more than five customers remain in a checkout line for over two minutes. A bank branch may want to identify when customers accumulate beyond the seated waiting area. A clinic may want to understand which registration periods repeatedly create congestion. A government service center may want to compare peak demand with staffed counters.
The technology only becomes meaningful when the measurement supports a decision.
Queue Length Is Not the Same as Waiting Time
A long queue does not always mean a poor service experience, and a short queue does not always mean fast service.
Ten people moving rapidly through several active counters may be less problematic than three customers waiting at a single slow desk. This is why mature queue analytics should avoid reducing the entire problem to a headcount.
The most useful deployments combine several signals:
- Queue length
- Duration above threshold
- Movement rate
- Number of open service points
- Time of day
- Location-specific operating rules
This creates a better operational picture than a simple people count.
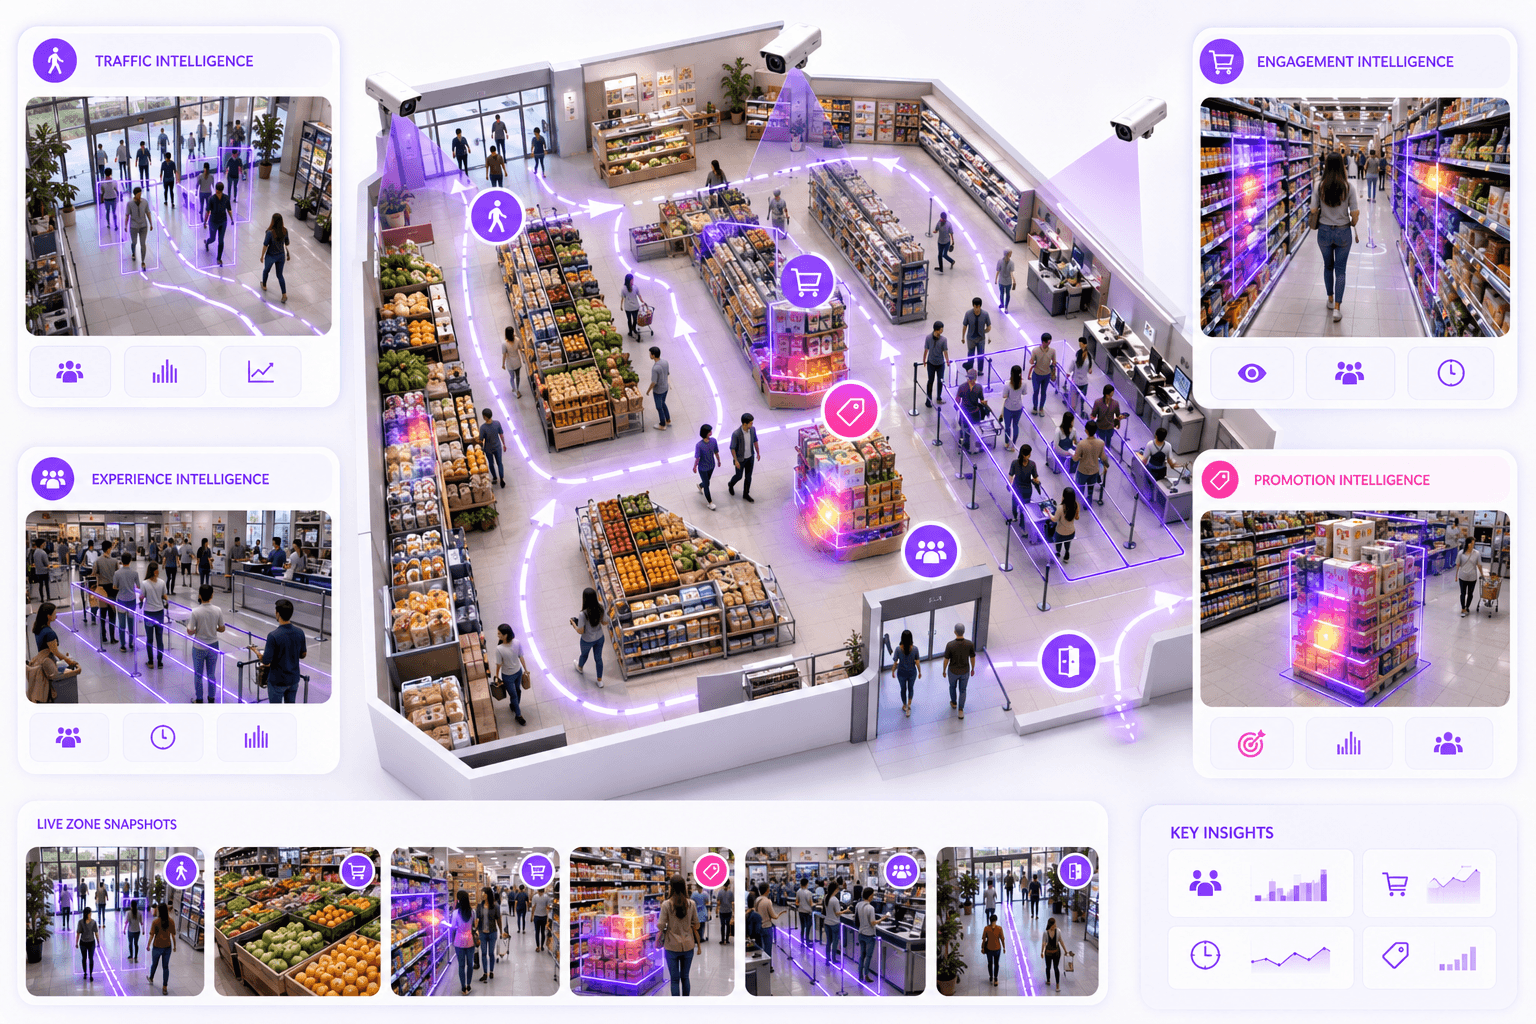
Where Queue Analytics Creates Value
Retail checkout operations
- Identify queues that exceed service standards
- Prompt teams to open additional counters
- Compare demand patterns across stores and time periods
- Support staffing plans with observed peak-hour data
Customer service desks
- Monitor waiting areas and service lanes
- Escalate persistent congestion
- Measure whether staffing changes reduce delays
- Identify recurring service bottlenecks
Banks and financial-service branches
- Observe customer accumulation at teller or advisory zones
- Compare queue conditions with active counters
- Support branch-level service reviews
- Improve peak-period planning
Clinics and hospitals
- Monitor registration, pharmacy or billing queues
- Detect crowding before it disrupts movement
- Provide evidence for scheduling and process improvement
- Support service-level review without manually timing every queue
Government and public-service centers
- Monitor high-volume service areas
- Identify branch or counter-level congestion
- Compare demand across days and service categories
- Create an auditable record of recurring wait conditions
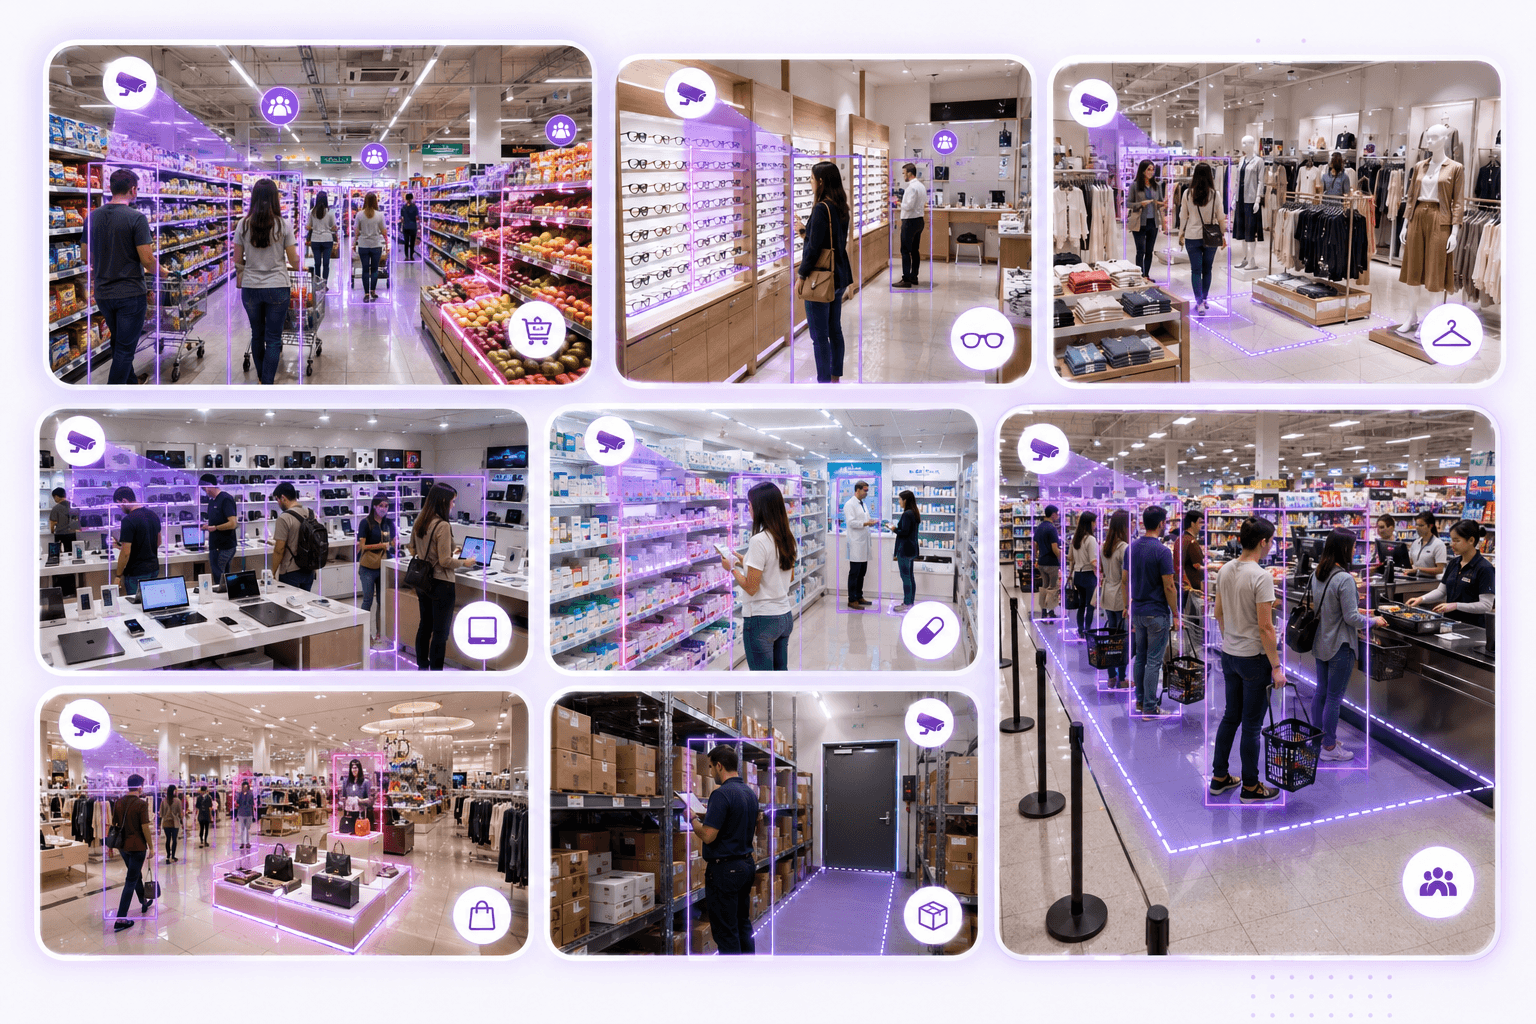
Can Existing Cameras Support Queue Analytics?
Often, yes.
Many retail stores, branches, clinics and service facilities already have cameras covering checkout lines, counters, entrances and waiting areas. These feeds may be suitable for queue intelligence without replacing the entire camera estate.
However, camera suitability depends on the exact workflow.
A wide ceiling-mounted camera may be useful for queue length but less suitable for individual waiting-time estimation. A camera placed behind the queue may lose visibility when people overlap. A checkout camera designed for loss prevention may not cover the complete line. A lobby camera may show crowding but not distinguish between waiting customers and people passing through.
A feasibility assessment should therefore review camera angle, subject size, occlusion, lighting, zone boundaries and stream stability before a pilot begins.
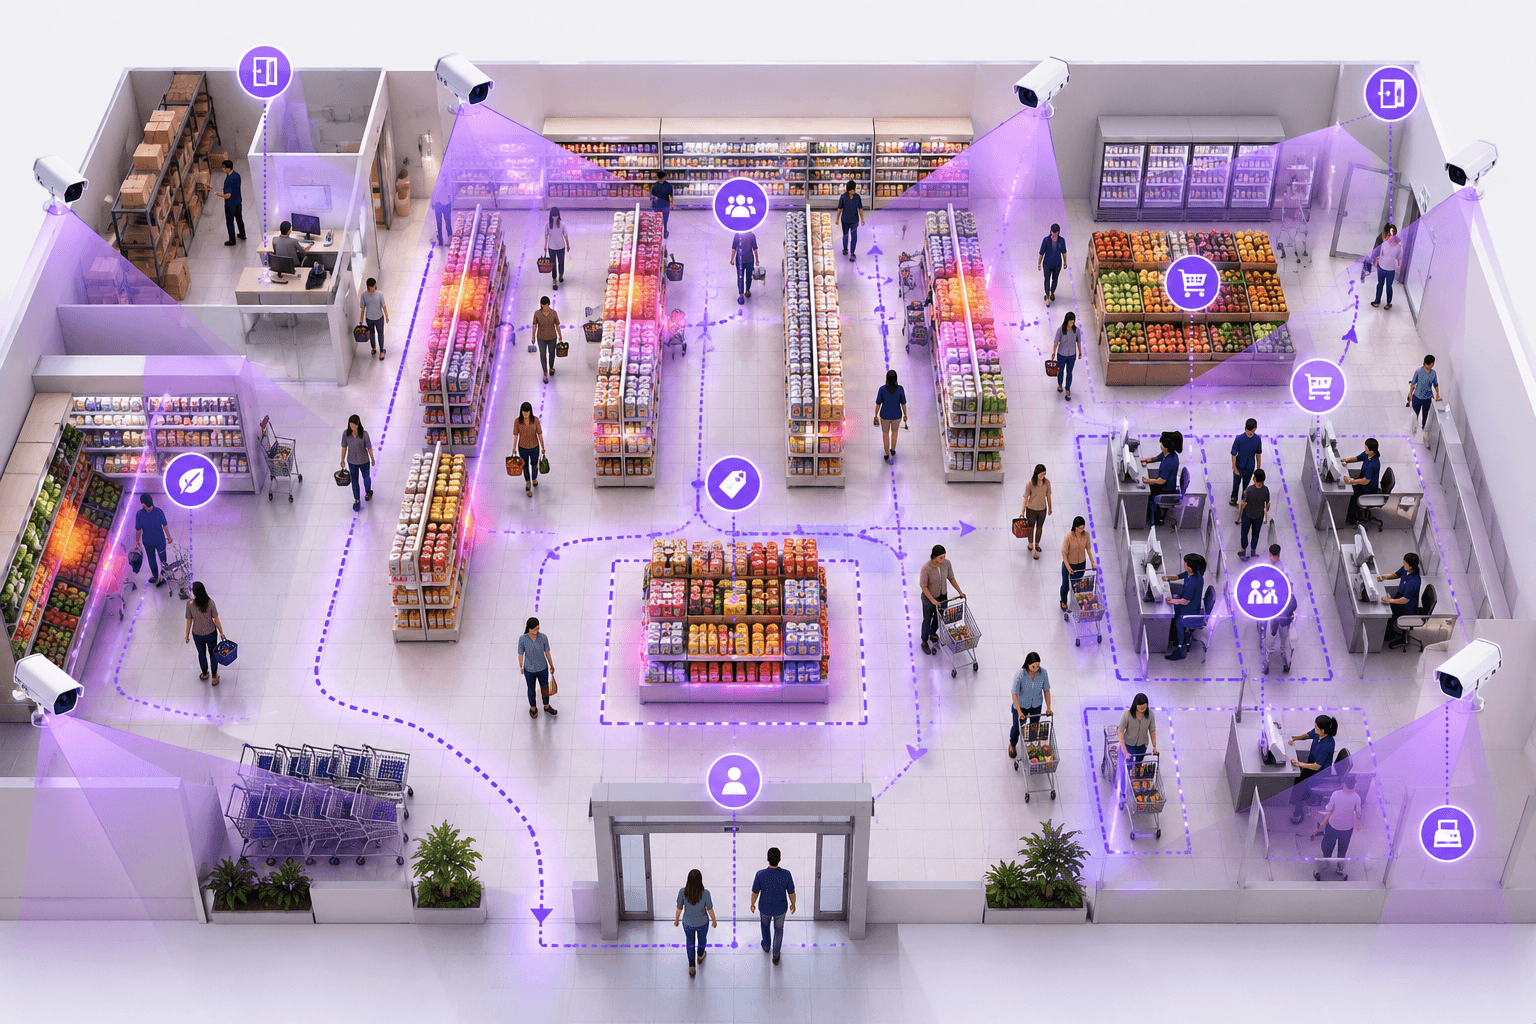
Five Conditions for a Reliable Queue Workflow
1. A clearly defined queue zone
The system needs to know which area represents the actual queue. Open retail floors and irregular waiting areas require more careful zone design than fixed lanes.
2. Sufficient camera coverage
The camera should capture the full waiting area and, where relevant, the service point. Partial coverage can produce misleading counts.
3. Manageable occlusion
If customers constantly overlap or the queue extends behind shelves, pillars or displays, the workflow may need another camera or a different measurement approach.
4. Business thresholds
The team must define what counts as an operational exception. Without thresholds, the system produces data but no decision.
5. A response owner
Someone must be responsible for acting on the alert, reviewing trends or adjusting staffing. Unowned alerts quickly become background noise.
The Workflow Matters More Than the Detection
A successful queue project does not end when the system sees six people in line.
It should answer what happens next.
A practical workflow might look like this:
- A camera observes a defined checkout or service queue.
- The AI layer estimates that the queue exceeds the configured threshold.
- The condition remains active for the agreed duration.
- An event is created with location, time and supporting evidence.
- A store manager, branch supervisor or operations team receives the notification.
- The team opens another service point, reallocates staff or acknowledges the exception.
- The event remains available for later trend and performance review.
That is the shift from queue counting to operational intelligence.
Real-Time Response and Historical Improvement
Queue analytics has two different forms of value.
The first is immediate response. A threshold event helps the local team act while the queue is still forming.
The second is historical improvement. Aggregated data helps management understand when, where and how often service capacity fails to match demand.
Historical analysis may reveal:
- Recurring congestion during specific hours
- Stores or branches with repeated service-threshold breaches
- Service points that remain inactive during peak periods
- Queue conditions linked to promotions, paydays, weekends or events
- Whether staffing changes actually improved service
The combination of real-time response and trend analysis creates a stronger business case than either one alone.
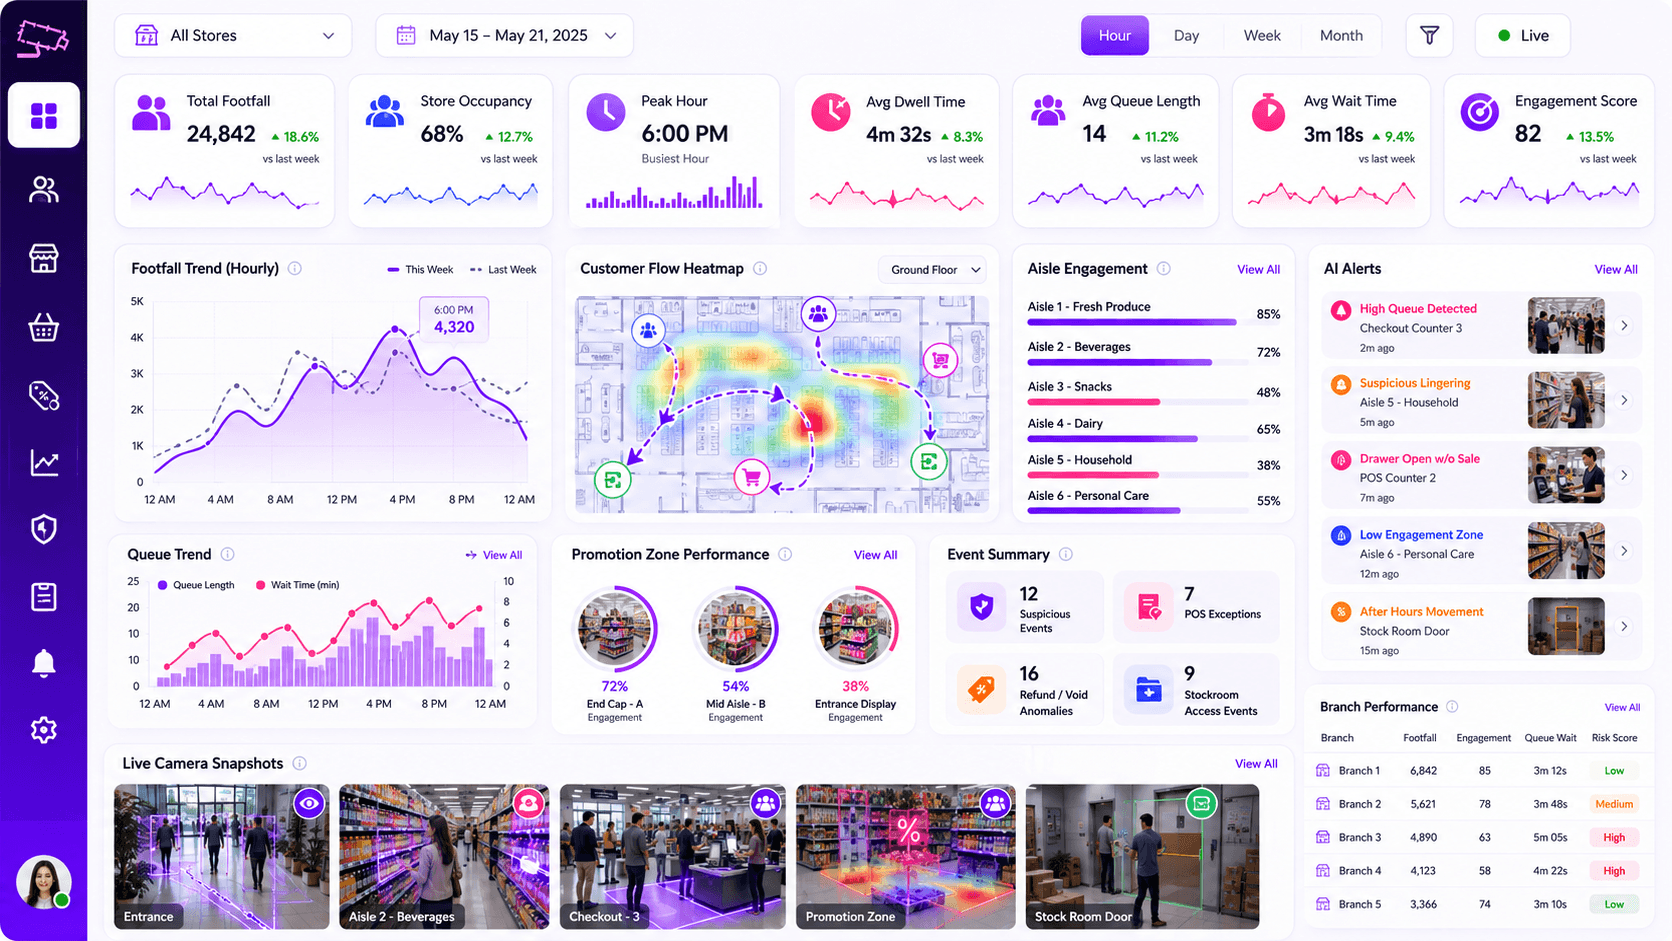
Common Reasons Queue Analytics Projects Underperform
- The project measures people but does not define an operational threshold.
- The camera does not capture the full queue.
- The workflow confuses passersby with waiting customers.
- Alerts have no clear owner.
- The business measures alert volume instead of service improvement.
- The pilot is run during unusually quiet conditions.
- The system is deployed across many sites before one workflow is validated properly.
These problems are usually preventable. A focused pilot with a realistic scene and a clear service rule is more valuable than a broad deployment built around generic analytics.
How to Structure a Queue Analytics Pilot
A practical pilot should test one or two locations where queue problems are frequent, visible and operationally important.
The pilot should define:
- The monitored queue zones
- The cameras and service points included
- The queue-length or waiting-condition thresholds
- The duration required before an alert is created
- Who receives and reviews the event
- How the response will be recorded
- Peak and non-peak testing periods
- The measures used to determine success
Metrics That Matter
The purpose is not to maximize the number of detected queue events.
Useful performance measures may include:
- Number of verified threshold breaches
- Average duration above threshold
- Response time after alert creation
- Reduction in repeated queue breaches
- Peak-period staffing alignment
- Number of counters active during high-demand periods
- Customer abandonment or complaint indicators, where available
- Operational adoption by store or branch teams
Privacy and Responsible Deployment
Queue analytics does not always require identifying individuals.
In many environments, the business objective can be achieved through anonymous people detection, zone occupancy and queue-state analysis rather than facial recognition or personal profiling.
The deployment should follow the organization’s privacy, retention and access-control policies. Buyers should understand what video is processed, what evidence is stored, how long it is retained and who can review it.
The architecture may run at the edge, on-premise, in the cloud or in a hybrid model depending on policy, connectivity and scale.
From Waiting Customers to Actionable Service Signals
A queue is visible operational demand.
The challenge is that teams often notice it too late, measure it inconsistently or lack data to understand why it keeps returning.
Queue analytics can help turn suitable existing camera coverage into a practical service-management workflow: observe the condition, apply a threshold, notify the right team, preserve the evidence and measure whether the response worked.
When those elements are connected, the camera does more than record a crowded counter. It becomes part of the customer-service operating system.
Queue analytics workflow review
Evaluate Queue Analytics for Your Retail or Service Environment
Omnivue helps organizations assess existing camera infrastructure for practical queue and service intelligence across retail stores, branches, clinics, public-service centers and other physical operations. A workflow review can help determine which existing cameras are suitable, how queue zones and thresholds should be defined, which locations are best for a pilot, how alerts should connect to staffing or service action and which real-time and historical metrics should be measured.